We have lingered long enough on the shores of the cosmic ocean. We are ready at last to set sail for the stars.
— Carl Sagan.
Ever since humans became sentient, we have been staring up at the night sky every night, trying to understand the message written across the heavens. What are those twinkling lights in the sky? What do they mean? Why are they there?
Well, we don't know what they mean – as far as we know, they don't mean anything – nor do we know why they are there. However, we do know what they are. They are stars, superheated balls of plasma floating around in the vast emptiness that is space. We can tell how far away they are, what they are made of, and how hot and bright they are. Some day we may even be able to visit them; unfortunately, the technology to take us there does not currently exist.
To learn how stars shine, click here.
Star Classifications
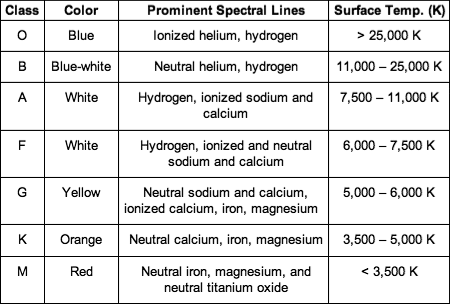
Although most of the stars illuminating the sky at night look the same, they are actually all different. Some stars are hot, large, and bright while others are cool, dim, and small. To organize these stars, we have come up with a couple of ways to organize them based on their traits. The two ways to be discussed here are the Harvard Classification Scheme and the Main Sequence Diagram (note: these are not mutually exclusive and actually work very well together).
The Harvard Classification Scheme was developed by Annie Jump Cannon,
a deaf woman who worked at Harvard Observatory under Edward C.
Pickering. This method of classifying stars is based on their surface
temperature. Cannon used their spectroscopy to determine where they
should be classified because there is not direct way to measure their
temperature. The specral lines of a star are the lines that light from the star
separates into when it is passed through a prism (this site does a much
better job of explaining it and goes much more in-depth if you are confused).
By studying the spectral lines, one can determine what elements are in a star
and therefore how hot it is. Hotter stars can create heavier elements, and
therefore their spectral lines will reflect that.
Cannon separated the stars into seven categories: O, B, A, F, G, and K. A
commonly used mnemonic device to remember these categories is Oh Be A
Fine Girl (or Guy), Kiss Me. O stars are hot, bright stars which shine brightest in ultraviolet light, with a wavelength of less than 89 nanometers. B stars also shine brightest in UV, but at wavelengths between 89 and 280 nanometers. A stars shine brightest in violet light, between 290 and 390 nm in wavelength. F stars have wavelenths between 390 nm and 480 nm, peaking in blue light. G stars are yellow stars whose wavelenths range from 480 to 560 nm. K stars are red stars with wavelengths of 560-780 nanometers. The coolest stars are M stars, which are red stars with wavelengths of 780 nanometers or greater.

The Main Sequence diagram (also called a Hertzprung-Russell diagram) graphs stars based on their luminosity and temperature. Most stars fall on a fairly straight (only slightly curved) line. This line is called the Main Sequence, and stars that fit on this line are called main sequence stars. Hot, bright stars are located in the upper left corner, while dim, cool stars are in the bottom right. Stars that fall off the main sequence are generally located in the bottom left corner (hot, dim stars) or the upper right (cool, bright stars). Hot dim stars are actually white dwarfs, which aren't actually stars as they don't fuse atoms in their core. Stars of the upper right are generally supergiants, such as Betelgeuse. Below is a simplified version of a Hertzprung-Russell diagram.

Luminosity
Luminosity is a measurement of how much light a star produces. To measure luminosity, we need need the radius and surface temperature. A bright star can either be cool and massive, or hot and not relatively small. However, changing temperature has a bigger effect on the luminosity of a star than changing the radius. Essentially, luminosity is proportional to the surface temperature of a star squared, times the radius of the star to the fourth power. Written out, the proportion is: L∝(T^2)(R^4)
Brightness
Brightness is a measurement of how luminous a star appears from Earth. While one star might be more luminous than another star, the less luminous star may appear to be brighter from Earth. This effect can be described by saying brightness is proportional to the luminosity of a star divided by the distance squared. The proportion is written like this: b∝L/(D^2)
Distance
We know how bright stars are, but to calculate that we need to know the distance of the star. How do we find the distance of the star, then? One way is to use parallax, or how much a star shifts in relation to other, more distant (and therefore stationary) stars. To measure parallax, you take a picture of the star at one point in Earth's orbit, then take a picture of the same star six months later. You then compare the star to others in the background that haven't moved, and see how far it shifted in comparison. Then find half the degrees of shift (also known as p). Divide one by p and there's your answer in parsecs. The diagram below should help.

Distance can also be found using the luminosity and brightness by adjusting the proportion used to describe brightness. The new proportion would be: (D^2)∝b/L
